to Metals
to Metal properties and tests
Tensile test and Stress-Strain Diagram
Dr. Dmitri Kopeliovich
Stress-Strain Diagram expresses a relationship between a load applied to a material and the deformation of the material, caused by the load .
Stress-Strain Diagram is determined by tensile test.
Tensile tests are conducted in tensile test machines, providing controlled uniformly increasing tension force, applied to the specimen.
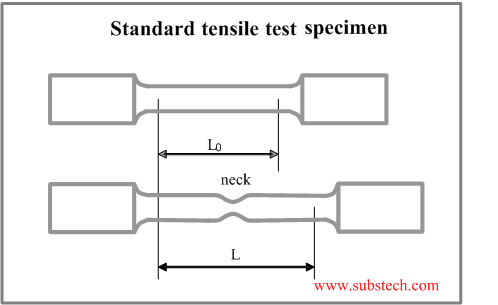
The specimen’s ends are gripped and fixed in the machine and its gauge length L0 (a calibrated distance between two marks on the specimen surface) is continuously measured until the rupture.
Test specimen may be round or flat in the cross-section.
In the round specimens it is accepted, that L0 = 5 * diameter.
The specimen deformation (strain) is the ratio of the increase of the specimen gauge length to its original gauge length:
δ = (L – L0) / L0
Tensile stress is the ratio of the tensile load F applied to the specimen to its original cross-sectional area S0:
σ = F / S0
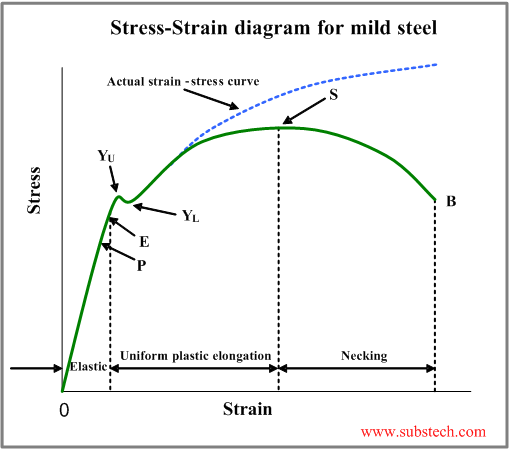
The initial straight line (0P)of the curve characterizes proportional relationship between the stress and the deformation (strain).
The stress value at the point P is called the limit of proportionality:
σp= FP / S0
This behavior conforms to the Hook’s Law:
σ = E*δ
Where E is a constant, known as Young’s Modulus or Modulus of Elasticity.
The value of Young’s Modulus is determined mainly by the nature of the material and is nearly insensitive to the heat treatment and composition.
Modulus of elasticity determines stiffness - resistance of a body to elastic deformation caused by an applied force.
The line 0E in the Stress-Strain curve indicates the range of elastic deformation – removal of the load at any point of this part of the curve results in return of the specimen length to its original value.
The elastic behavior is characterized by the elasticity limit (stress value at the point E):
σel= FE / S0
For the most materials the points P and E coincide and therefore σel=σp.
A point where the stress causes sudden deformation without any increase in the force is called yield limit (yield stress, yield strength):
σy= FY / S0
The highest stress (point YU) , occurring before the sudden deformation is called upper yield limit .
The lower stress value, causing the sudden deformation (point YL) is called lower yield limit.
The commonly used parameter of yield limit is actually lower yield limit.
If the load reaches the yield point the specimen undergoes plastic deformation – it does not return to its original length after removal of the load.
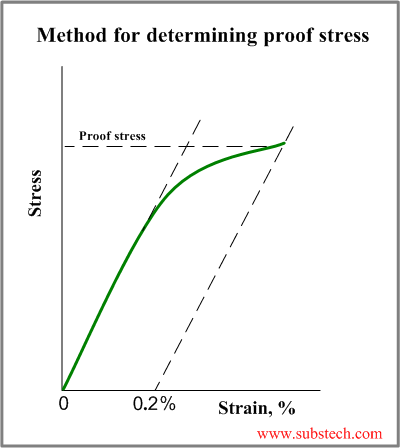
Hard steels and non-ferrous metals do not have defined yield limit, therefore a stress, corresponding to a definite deformation (0.1% or 0.2%) is commonly used instead of yield limit. This stress is called proof stress or offset yield limit (offset yield strength):
σ0.2%= F0.2% / S0
The method of obtaining the proof stress is shown in the picture.
As the load increase, the specimen continues to undergo plastic deformation and at a certain stress value its cross-section decreases due to “necking” (point S in the Stress-Strain Diagram). At this point the stress reaches the maximum value, which is called ultimate tensile strength (tensile strength):
σt= FS / S0
Continuation of the deformation results in breaking the specimen - the point B in the diagram.
The actual Stress-Strain curve is obtained by taking into account the true specimen cross-section instead of the original value.
Other important characteristic of metals is ductility - ability of a material to deform under tension without rupture.
Two ductility parameters may be obtain from the tensile test:
Relative elongation - ratio between the increase of the specimen length before its rupture and its original length:
δ = (Lm– L0) / L0
Where Lm– maximum specimen length.
Relative reduction of area - ratio between the decrease of the specimen cross-section area before its rupture and its original cross-section area:
ψ= (S0– Smin) / S0
Where Smin– minimum specimen cross-section area.
to top


